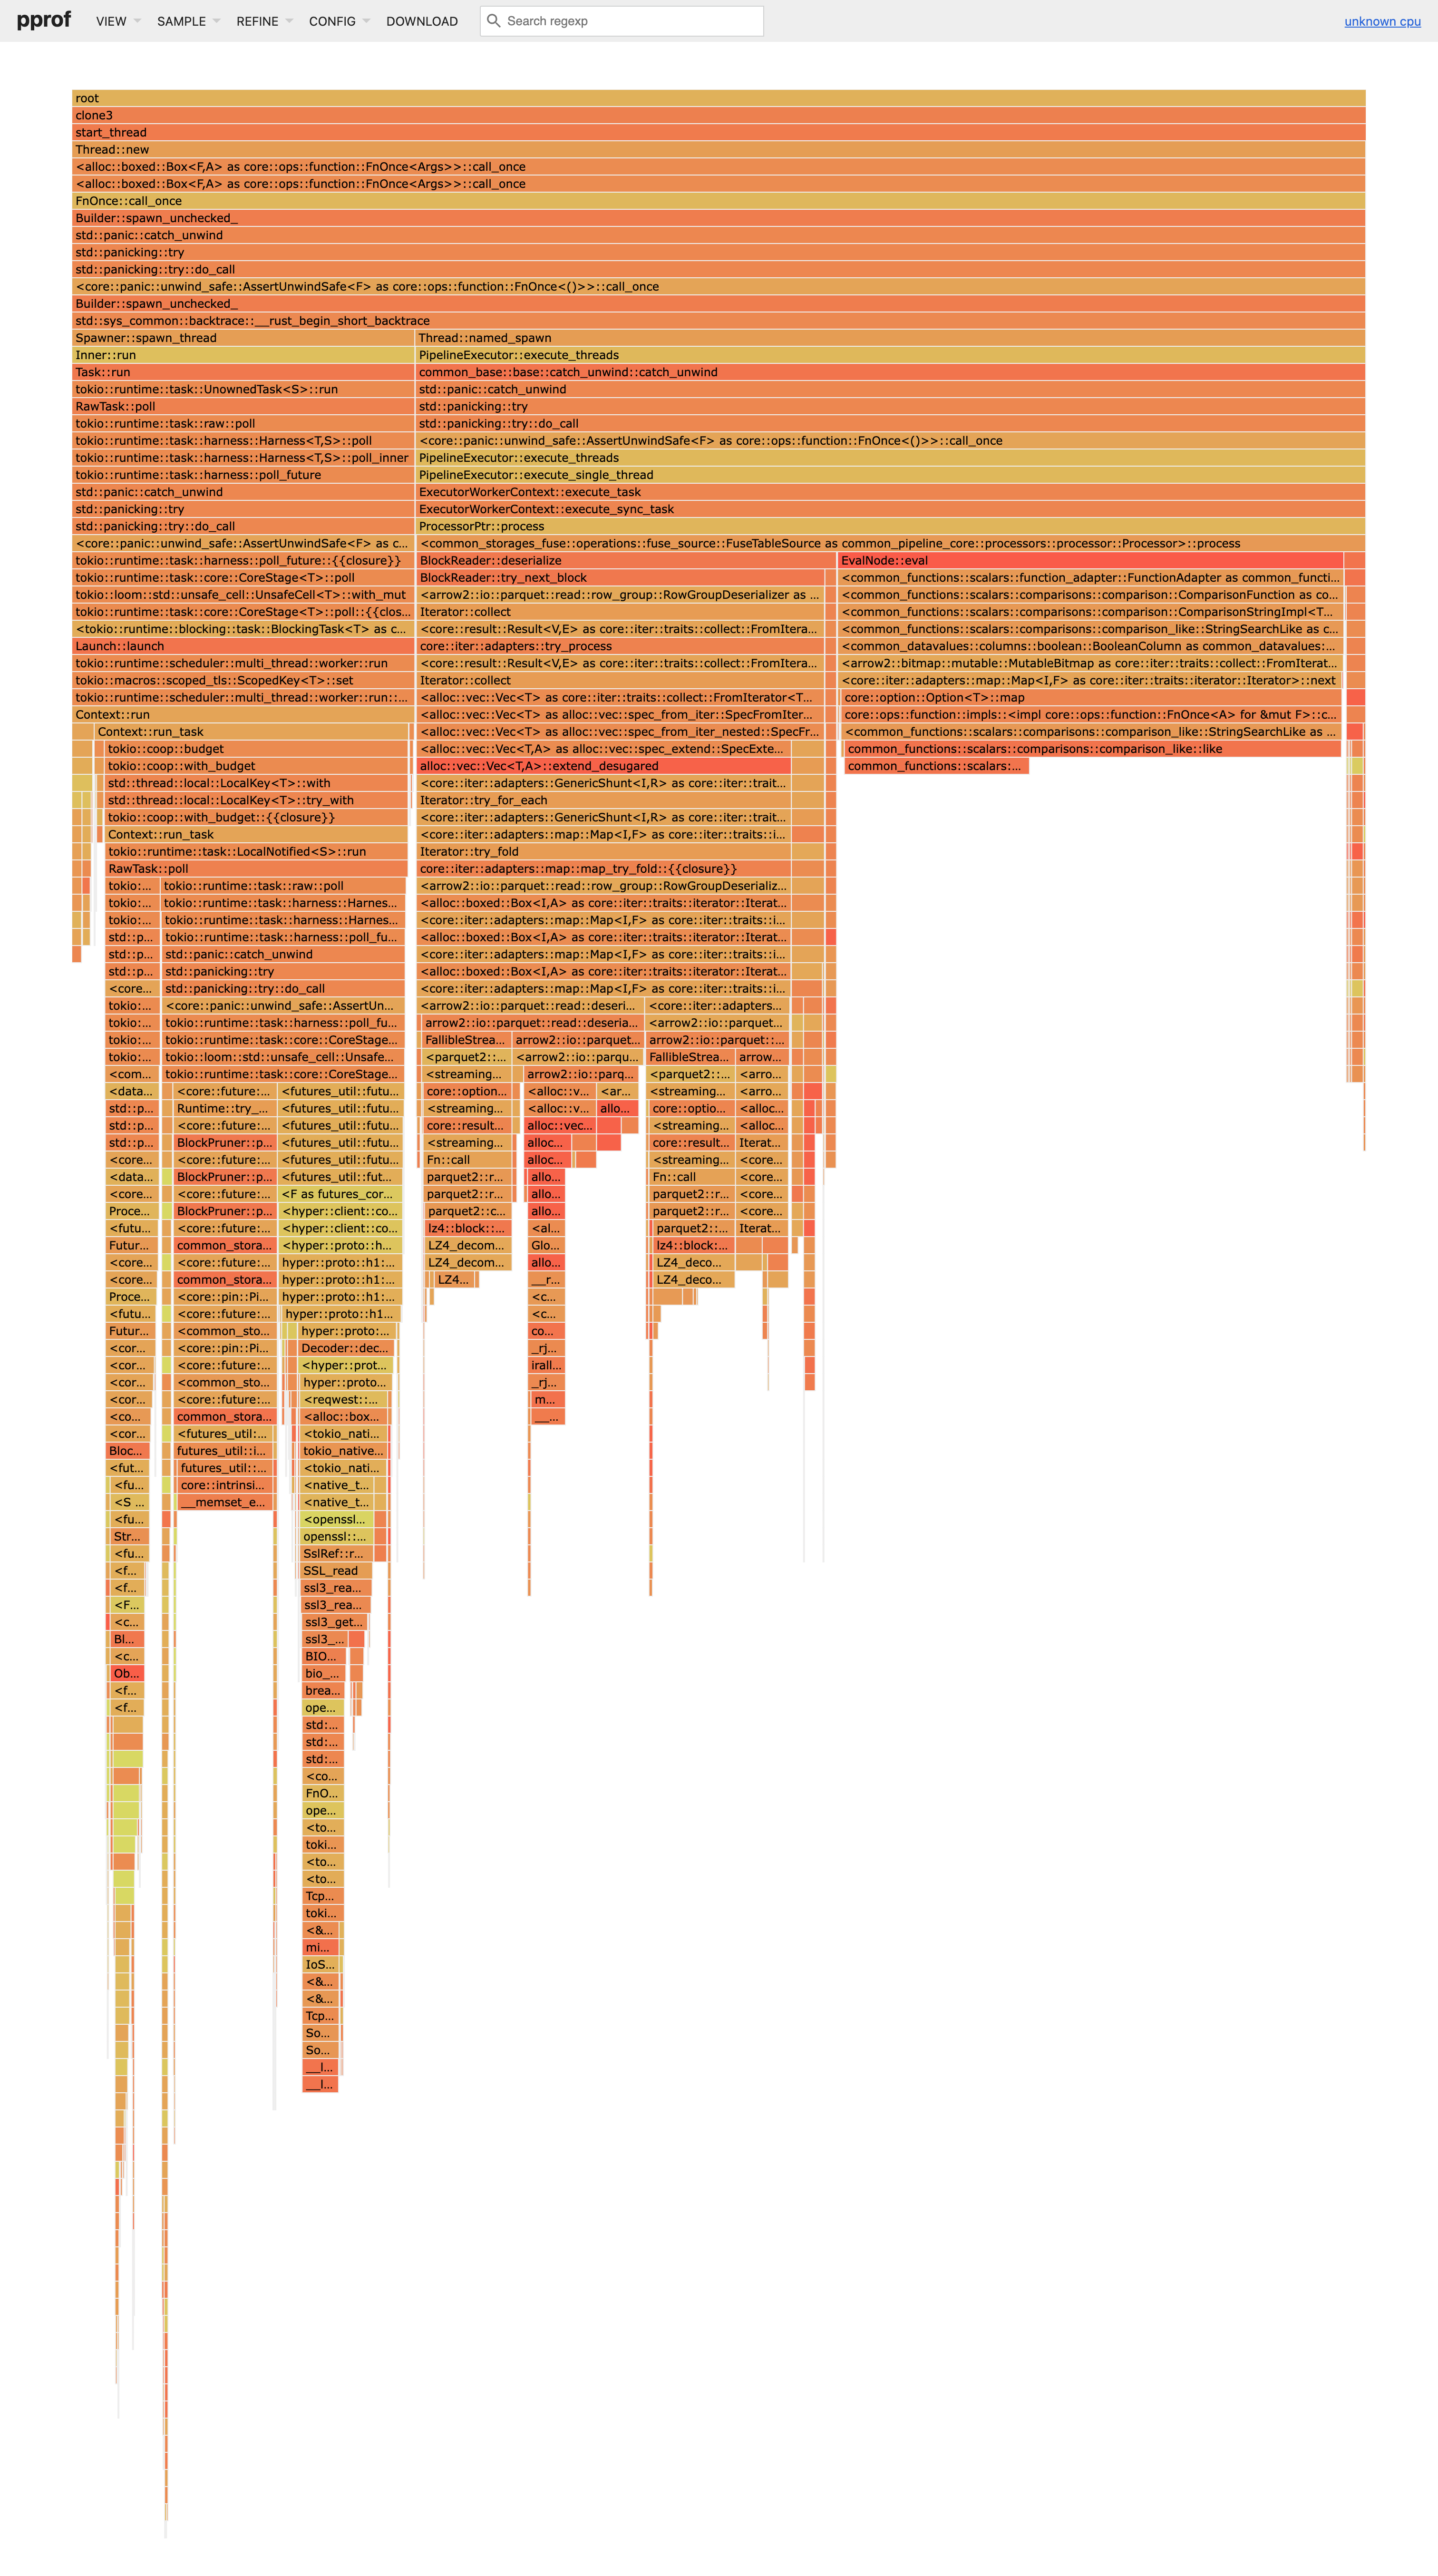
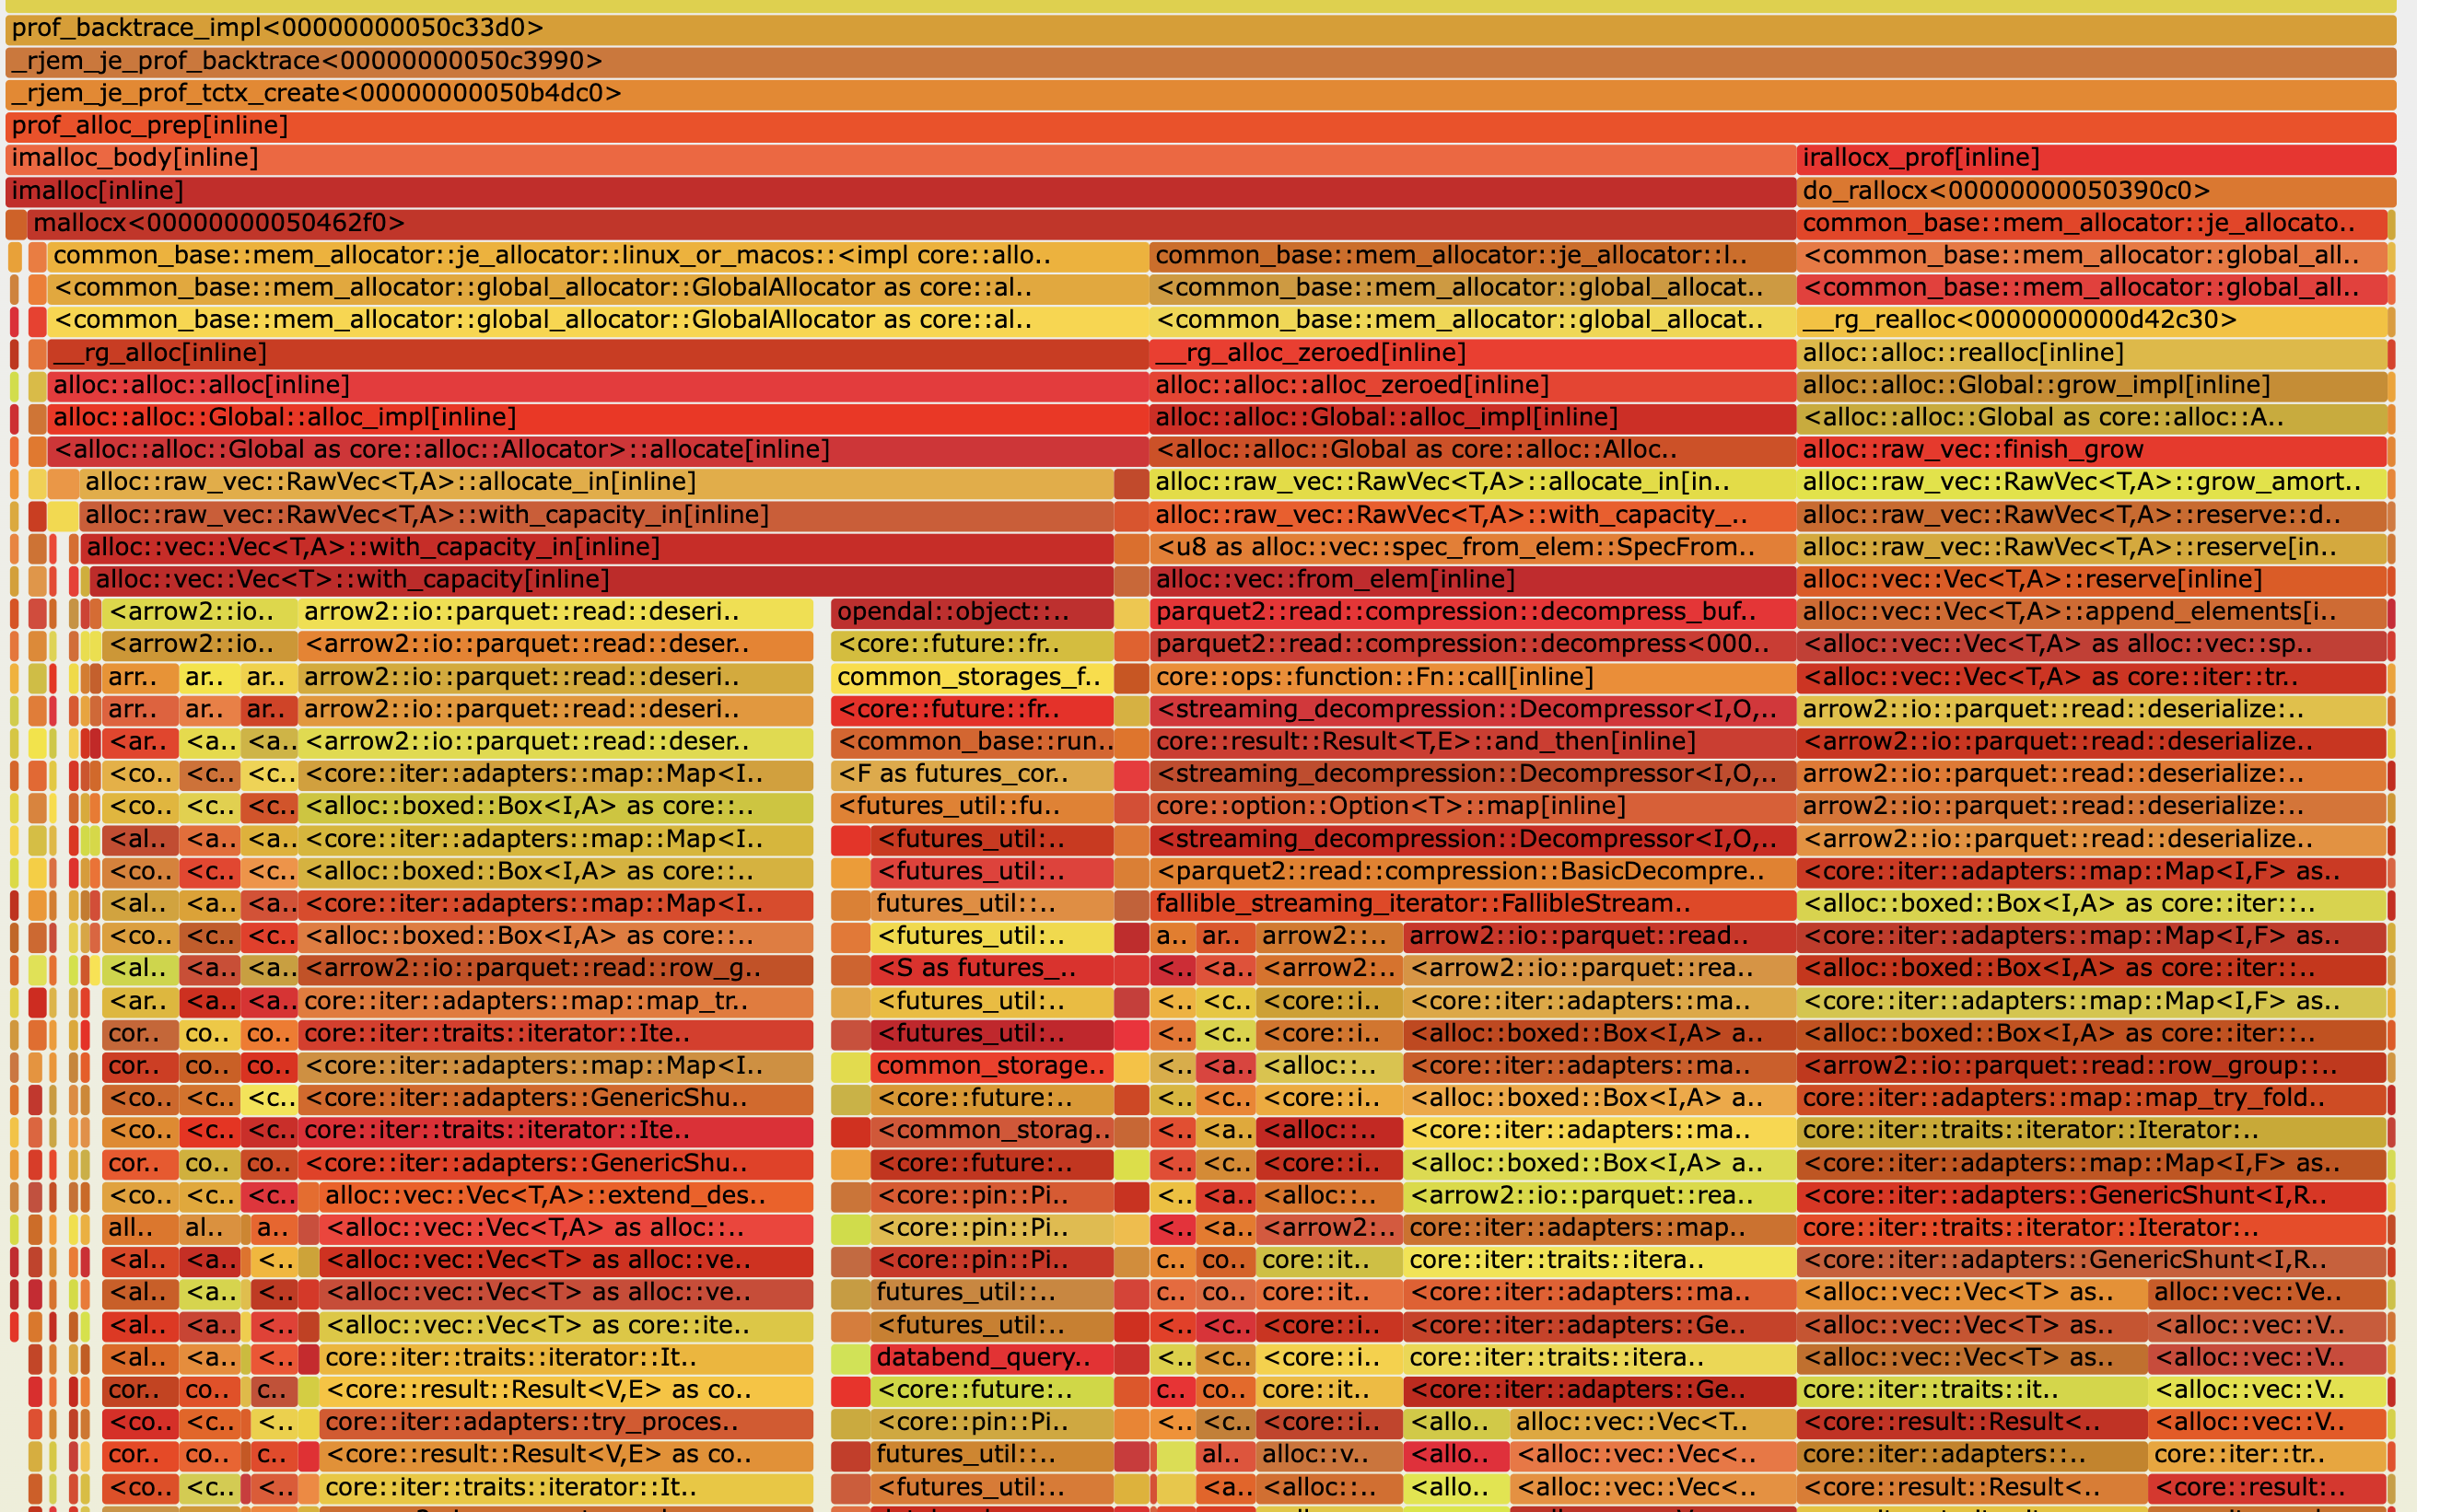
Profiling CPU and memory for Go applications is easy and can be of great help in performance troubleshooting, for example, with flamegraphs. For Rust applications, however, the profiling requires extra work. This post explains how to use flamegraphs to visualize performance data of your CPU and memory for Databend.
To support CPU and memory profiling, some APIs need to be included in the application. For example, Databend includes the following in the code:
CPU Profiling
To do a CPU profiling, simply run the following command on the Databend server:
go tool pprof -http="0.0.0.0:8081" http://localhost:8080/debug/pprof/profile?seconds=30
localhost:8080: Databend management address.0.0.0.0:8081: pprof server address.seconds=30: Profiling lasts for 30 seconds.
Then open the URL <your-ip>:8081/ui/flamegraph in your browser to view the flamegraph:

Memory Profiling
Compared to CPU profiling, memory profiling is a bit more involved, and can be done in the following steps:
1. Enable Memory Profiling
cargo build --bin databend-query --release --features memory-profiling
2. Start with MALLOC_CONF
MALLOC_CONF=prof:true,lg_prof_interval:30 ./target/release/databend-query
lg_prof_interval:30: Profiles are dumped into a file for each allocation of 1 GiB (2^30 bytes).
3. Replace add2line with a Faster One
This will rocket your jeprof from 30 minutes to 3 seconds.
git clone https://github.com/gimli-rs/addr2line
cd addr2line
cargo b --examples -r
cp ./target/release/examples/addr2line <your-addr2line-find-with-whereis-addr2line>
4. Upgrade jeprof to the Latest Version
jeprof needs an upgrade because the old version doesn't support some parameters for creating flamegraphs. jeporf is a perl script, so the way to upgrade it is a little bit rough-and-ready.
First, find out the path of your local jeprof file:
whereis jeprof
Open and copy the latest version of jeprof, then overwrite your local copy with the copied script EXCEPT for the following two parameters:
my $JEPROF_VERSION = "5.2.1-0-gea6b3e973b477b8061e0076bb257dbd7f3faa756";
my $PPROF_VERSION = "2.0";
5. Create a Flamegraph
jeprof ./databend-query-main ./jeprof.206330.563.i563.heap --collapse | flamegraph.pl --reverse --invert --minwidth 3 > heap.svg
flamegraph.pl: Download from GitHub.databend-query-main: Path to your executable.jeprof.206330.563.i563.heap: Selects a heap file.

